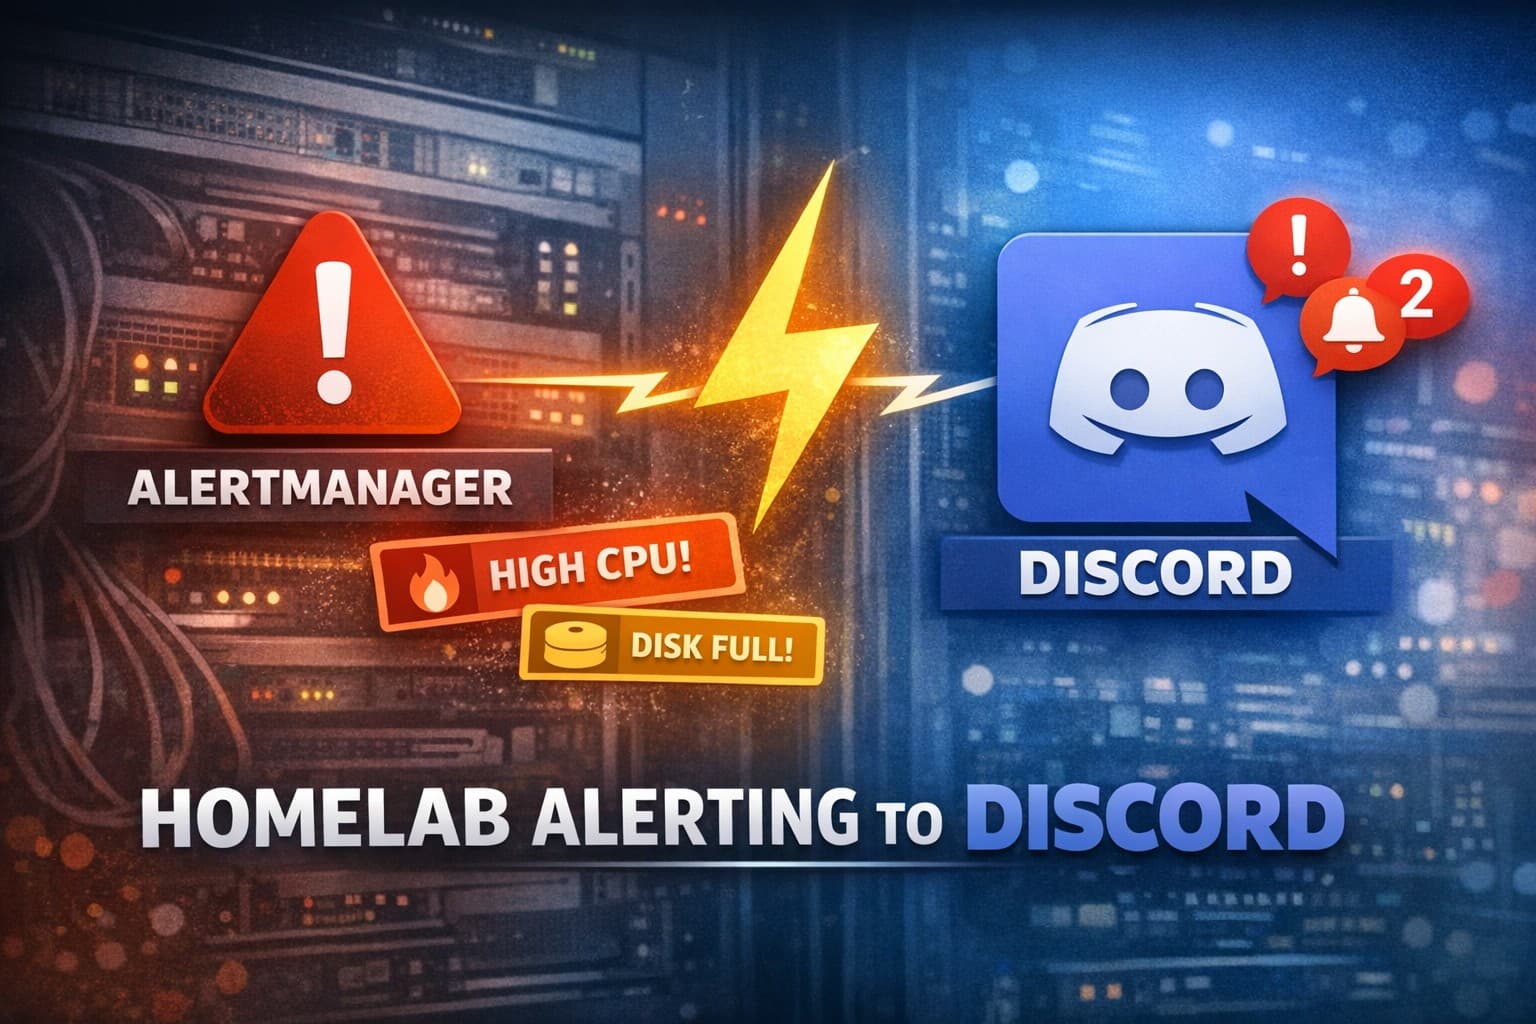
Homelab Alerting with Alertmanager and Free Discord Integration
How to set up free, reliable alerting for your homelab using Prometheus Alertmanager and Discord webhooks.
📚 Part of: Homelab Observability
Why Alerting Matters in Your Homelab
Monitoring is only half the battle—alerting ensures you know when something goes wrong. Whether it's a downed service, high resource usage, or a failed backup, timely alerts help you fix issues before they become disasters.
What is Alertmanager?
Alertmanager is part of the Prometheus stack. It handles alerts sent by Prometheus, deduplicates them, groups them, and routes them to your preferred notification channels (email, chat, etc.).
Free Alerting Options
Alertmanager supports many integrations:
- Email (requires SMTP server)
- Slack (free tier available)
- Discord (free, easy to set up)
- PagerDuty, OpsGenie, etc. (paid)
This guide focuses on Discord, which is free and works well for personal/homelab use.
Prerequisites
- Prometheus and Alertmanager running (e.g., via kube-prometheus-stack Helm chart)
- Access to your Discord server (with permissions to add webhooks)
kubectlaccess to your cluster
Step 1: Create a Discord Webhook
- In Discord, go to your server and select the channel for alerts.
- Click the gear icon (Edit Channel) → Integrations → Webhooks → New Webhook.
- Name it (e.g.,
Alertmanager) and copy the Webhook URL.
Step 2: Store the Webhook URL as a Kubernetes Secret
Never store secrets in plain text! Save your webhook URL as a secret:
kubectl create secret generic alertmanager-discord-webhook \
  --from-literal=webhook-url="https://discord.com/api/webhooks/your-webhook-id" \
  -n monitoring
Step 3: Configure Alertmanager for Discord
Step 3: Enable Native Discord Integration in Alertmanager
Example: Working values.yaml for kube-prometheus-stack
Some chart versions require a "null" receiver and explicit image override for Alertmanager to start correctly. Here is a working example:
grafana:
  enabled: true
  persistence:
    enabled: true
    type: pvc
    size: 10Gi
  service:
    type: ClusterIP

prometheus:
  prometheusSpec:
    retention: 7d
    # If this doesn't work with your chart version, remove it first and re-add later.
    # Many versions use "additionalScrapeConfigs" or different keys.
    additionalScrapeConfigsSecret:
      name: additional-scrape-configs
      key: additional-scrape-configs.yaml
    storageSpec:
      volumeClaimTemplate:
        spec:
          accessModes:
            - ReadWriteOnce
          resources:
            requests:
              storage: 20Gi

alertmanager:
  enabled: true
  alertmanagerSpec:
    replicas: 1
    image:
      repository: prometheus/alertmanager
      tag: v0.28.0
  config:
    global: {}
    route:
      receiver: discord
      group_wait: 10s
      group_interval: 5m
      repeat_interval: 3h
      group_by: ["namespace"]
      routes:
        - receiver: "null"
          matchers:
            - alertname = "Watchdog"
    receivers:
      - name: "null"
      - name: "discord"
        discord_configs:
          - webhook_url: "https://discord.com/api/webhooks/your-webhook-id"
            send_resolved: true

kubeEtcd:
  enabled: false
kubeControllerManager:
  enabled: false
kubeScheduler:
  enabled: false
Note: The "null" receiver and subroute for "Watchdog" are required by some chart versions to avoid config errors. The image override ensures compatibility with Discord integration. Replace the webhook URL with your actual Discord webhook.
Troubleshooting: Avoiding route.receiver: null Errors
Some versions of kube-prometheus-stack Helm charts can merge YAML incorrectly, resulting in route.receiver: null and preventing Alertmanager from starting. If you see errors about an undefined receiver "null" or your Alertmanager pod does not start, use the stringConfig field instead of config:
alertmanager:
  enabled: true
  alertmanagerSpec:
    replicas: 1
  stringConfig: |
    global: {}

    route:
      receiver: discord
      group_wait: 10s
      group_interval: 5m
      repeat_interval: 3h

    receivers:
      - name: discord
        discord_configs:
          - webhook_url: "https://discord.com/api/webhooks/your-webhook-id"
            send_resolved: true
This workaround avoids YAML merge issues and ensures the Alertmanager pod starts reliably. Replace the webhook URL with your actual Discord webhook.
If you followed the previous monitoring post, you should already have kube-prometheus-stack (and Alertmanager) installed in your cluster. If not, refer to the earlier guide for installation steps.
As of Alertmanager v0.25.0 and later, you can send alerts directly to Discord without any relay pod!
How to set it up:
-
Edit your kube-prometheus-stack
values.yamlfile. If you previously disabled Alertmanager (e.g.,alertmanager.enabled: false), set it to true:yaml code-highlightalertmanager: enabled: true -
Add or update the
config:section underalertmanager:to use the native Discord integration. Note: Alertmanager does not support referencing Kubernetes secrets directly in the config. You must paste the Discord webhook URL into your values.yaml or config file:yaml code-highlightalertmanager: config: global: {} route: receiver: 'discord' group_wait: 10s group_interval: 5m repeat_interval: 3h receivers: - name: 'discord' discord_configs: - webhook_url: https://discord.com/api/webhooks/<YOUR_WEBHOOK_URL> send_resolved: trueSecurity Note: The Discord webhook URL is sensitive. If you want to avoid storing it in git, use a script or CI/CD pipeline to inject the value from a Kubernetes secret or environment variable into your values.yaml before deploying. For manual workflows, decode the secret and paste it in as needed.
Example to decode your secret:
sh code-highlightkubectl get secret alertmanager-discord-webhook -n monitoring -o jsonpath="{.data.webhook-url}" | base64 --decode; echoThen copy the output and paste it into your config as shown above.
-
Save the file and upgrade your Helm release:
sh code-highlighthelm upgrade monitoring prometheus-community/kube-prometheus-stack -n monitoring -f values.yaml -
If you previously deployed a relay pod (like rogerrum/alertmanager-discord), you can now delete it:
sh code-highlightkubectl delete deployment alertmanager-discord -n monitoring kubectl delete service alertmanager-discord -n monitoring
That’s it! Alertmanager will now send alerts directly to your Discord channel.
Step 4: Reload Alertmanager
If using Helm, upgrade your release:
helm upgrade monitoring prometheus-community/kube-prometheus-stack -n monitoring -f values.yaml
Or, if you edit the config directly, reload the Alertmanager pod.
Step 5: Test Your Alerts
Create a simple test alert rule:
apiVersion: monitoring.coreos.com/v1
kind: PrometheusRule
metadata:
  name: test-alert
  namespace: monitoring
  labels:
    release: monitoring
spec:
  groups:
    - name: test.rules
      rules:
        - alert: AlwaysFiring
          expr: vector(1)
          for: 1m
          labels:
            severity: warning
          annotations:
            summary: "This is a test alert from Alertmanager."
Apply it:
kubectl apply -f test-alert.yaml
You should see a message in your Discord channel within a minute or two.
Cleaning Up the Test Alert
Once you’ve confirmed that alerts are working and you see the test message in Discord, you should remove the test alert to avoid constant notifications:
kubectl delete prometheusrule test-alert -n monitoring
Your discord message might look something like this depending on the alert you setup:
Example: Real Alert for High CPU on Proxmox
Here’s how to set up a real alert for high CPU usage on a Proxmox node (assuming you have node_exporter or a similar exporter set up):
apiVersion: monitoring.coreos.com/v1
kind: PrometheusRule
metadata:
  name: proxmox-high-cpu
  namespace: monitoring
  labels:
    release: monitoring
spec:
  groups:
    - name: proxmox.rules
      rules:
        - alert: ProxmoxHighCPU
          expr: avg by (instance) (rate(node_cpu_seconds_total{mode!="idle"}[5m])) > 0.85
          for: 5m
          labels:
            severity: warning
          annotations:
            summary: "High CPU usage on Proxmox node {{ $labels.instance }}"
            description: "CPU usage has been above 85% for more than 5 minutes."
You can adapt this pattern for memory, disk, or other metrics. Adjust the expr and thresholds to fit your environment.
Troubleshooting
- No alerts in Discord?
- Check the
alertmanager-discordpod logs. - Ensure the Secret and environment variable are correct.
- Confirm Alertmanager is sending to the right webhook URL.
- Check the
- Alertmanager config errors?
- Use
kubectl logsandkubectl describeto debug. - Validate your YAML with
yamllintor an online tool.
- Use
Best Practices
- Use a dedicated Discord channel for alerts.
- Rotate webhook URLs if you suspect they are leaked.
- Use labels and routing in Alertmanager to control which alerts go to Discord.
- Consider adding other receivers (email, Slack) for redundancy.
Resources
With this setup, you’ll never miss a critical event in your homelab—without spending a dime!
This post is Part 2 of my Homelab Observability series:
- Part 1: Metrics with Grafana + Prometheus ✅
- Part 2: Alerting with Alertmanager ✅
- Part 3: Logs with Loki
- Part 4: Capacity planning with real data
Real-World Platform Engineering in Your Inbox
One email a week. Deep dives on Kubernetes, homelab builds, platform tooling, and building in public from someone who does this for a living.
No fluff, no sponsored blasts. Unsubscribe any time.
Reach Engineers Who Build Platforms
My readers are Staff Engineers, Platform Engineers, and DevOps/SRE leads — the people who evaluate, buy, and recommend infrastructure tooling at their companies.
- → Sponsored posts, newsletter placements, and resource page features available
- → Audience: platform engineering, Kubernetes, GitOps, and homelab builders
- → Formats tailored to technical audiences — no generic ad copy
📚 Part of: Homelab Observability
Related Posts
Monitoring My Homelab with Grafana: From Proxmox to Kubernetes
A practical, beginner-friendly observability setup for a two-host Proxmox homelab: Prometheus + Grafana in Kubernetes, scraping Proxmox hosts and Pi-hole.
Kubernetes Logging with Loki
Collect, store, and query Kubernetes logs using Loki with MinIO object storage and Grafana.
Build Your First MCP Server: Give Claude Superpowers Over Your Homelab
Learn how to build a custom MCP server in Python that lets Claude directly query your Kubernetes cluster, check running containers, and manage your homelab. No more copy-pasting terminal output.